While the cost of installing solar panels has fallen dramatically (more than 70% since 2010, according to the Solar Energy Industries Association ) and continues to decline, cost is still—understandably—a major consideration for customers.
However, when assessing the price of a solar installation, it’s important to evaluate that expense like an investment and consider the value it will provide over time, compared to other ways you could use the money.
One way to think about the value of installing solar is in terms of how it compares to investing in the stock market. A 2015 study by the North Carolina Clean Energy Technology Center explored the financial returns from residential solar systems around the country compared to typical returns from the stock market—and you might be surprised by the results. In many areas, the study found that the 25-year returns from a home solar system exceed those from an equivalent investment in the stock market!
In today’s article, we delve into the study’s findings to give prospective solar customers a better sense of how adding solar can help your bottom-line.
How Solar Returns Compare to the Stock Market
The study, Going Solar in America: Ranking Solar’s Value to Consumers in America’s Largest Cities, finds that “in 46 of America’s 50 largest cities, a fully-financed, typically-sized solar PV system is a better investment than the stock market.” It also found that in 20 of those cities, paying cash upfront for the system is also a better investment than the stock market.
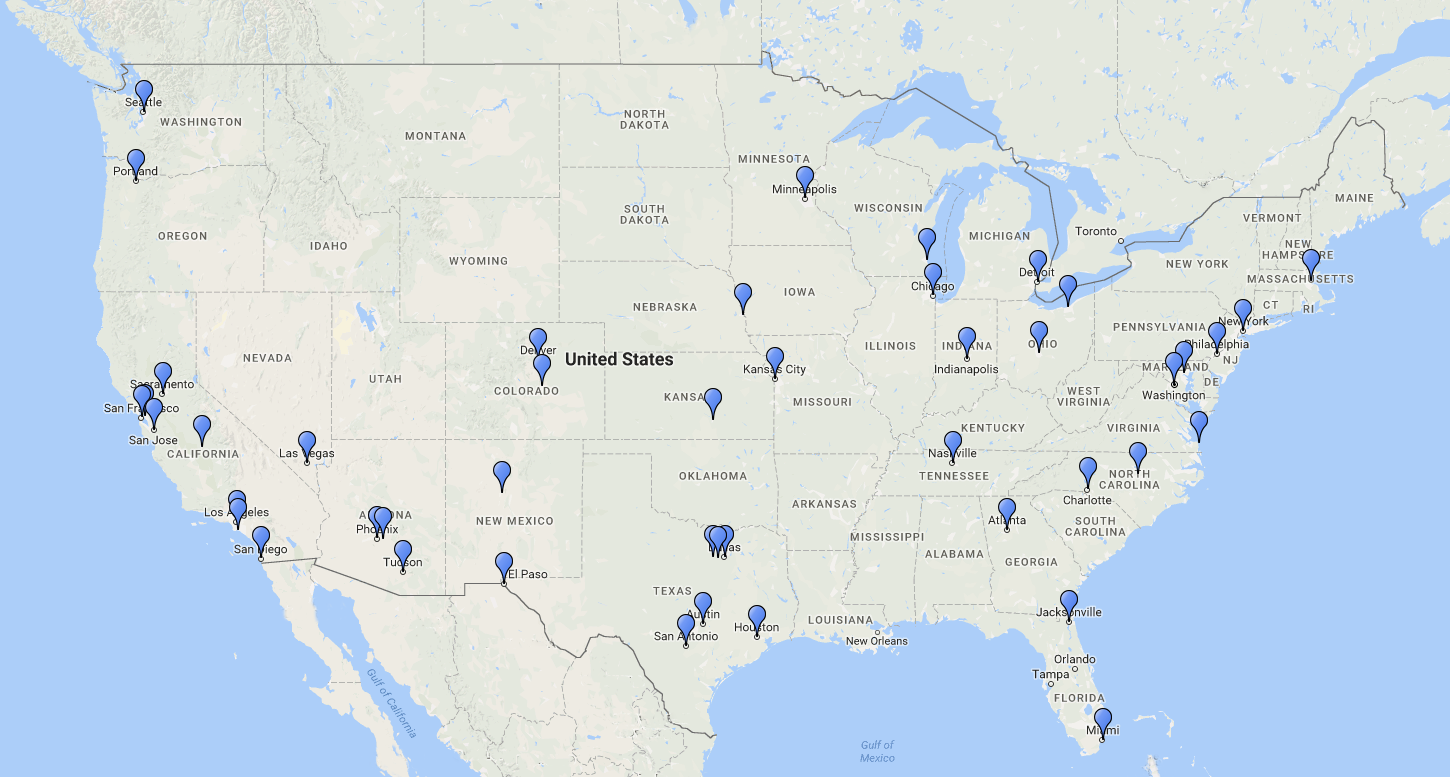 Figure 1: The 46 cities (of the 50 largest cities) in the U.S., where the financial returns from a fully financed 5kW solar system outperform 25-year returns from the stock market.
The study used a metric called Net Present Value (NPV) as the basis for the analysis. Net Present Value presents the value of future cash flows from an investment in present-day dollars. This is very important because money that you receive in the future is worth less than cash in hand today (a principle known as the time value of money).
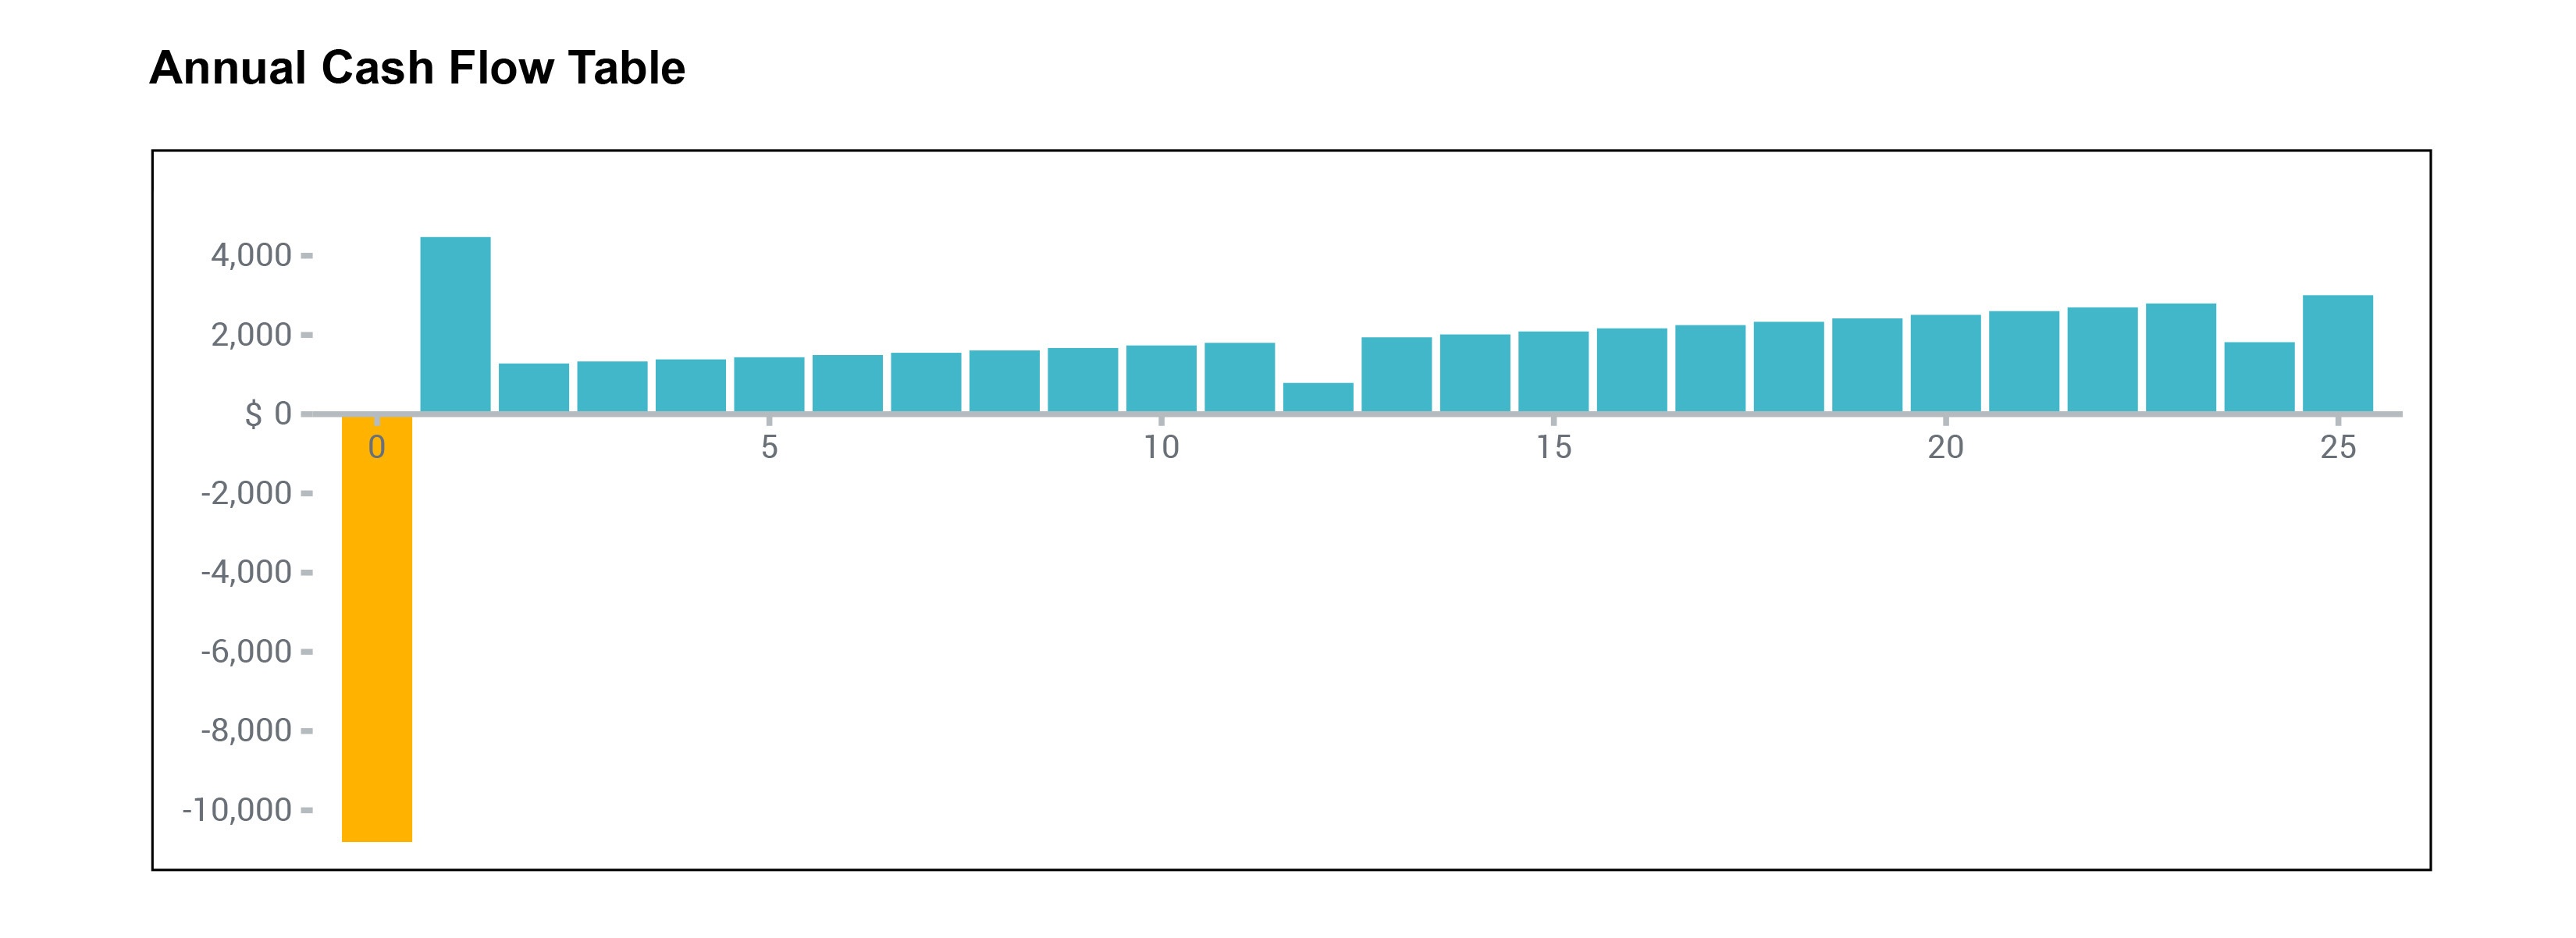 Figure 2: An example of cash flows over time from a solar installation. Net Present Value, calculated as the sum of discounted future cash flows, indicates the present-day dollar value of this future income.
The study’s authors calculated the Net Present Value for a 5 kW solar installation in each of the 50 largest cities in the US and compared this to the 25-year return of the Standard & Poor’s (S&P) 500 stock index. The authors note that they selected the S&P 500 stock index for comparison because of its status as one of the “most well-known and well-diversified representations of the U.S. equities market.”
For each city, the NPV of a solar installation was calculated under two scenarios:
1) if the system was fully financed (based on a loan for the full cost with an interest rate of 5%), and
2) for an upfront cash purchase.
Because loan financing distributes the cost of the purchase over time, allowing customers to keep more of their income in the short-term, the financed systems had higher NPVs and outperformed investments indexed to the S&P 500 in many more areas of the country.
In 92% of the 50 cities examined, a financed solar system outperformed the stock market (see Figure 1 above). Systems paid for upfront outperformed the stock market in only 40% of those cities (Figure 3). This makes the important point that different financing options can have a big impact on the value you get from your solar installation.
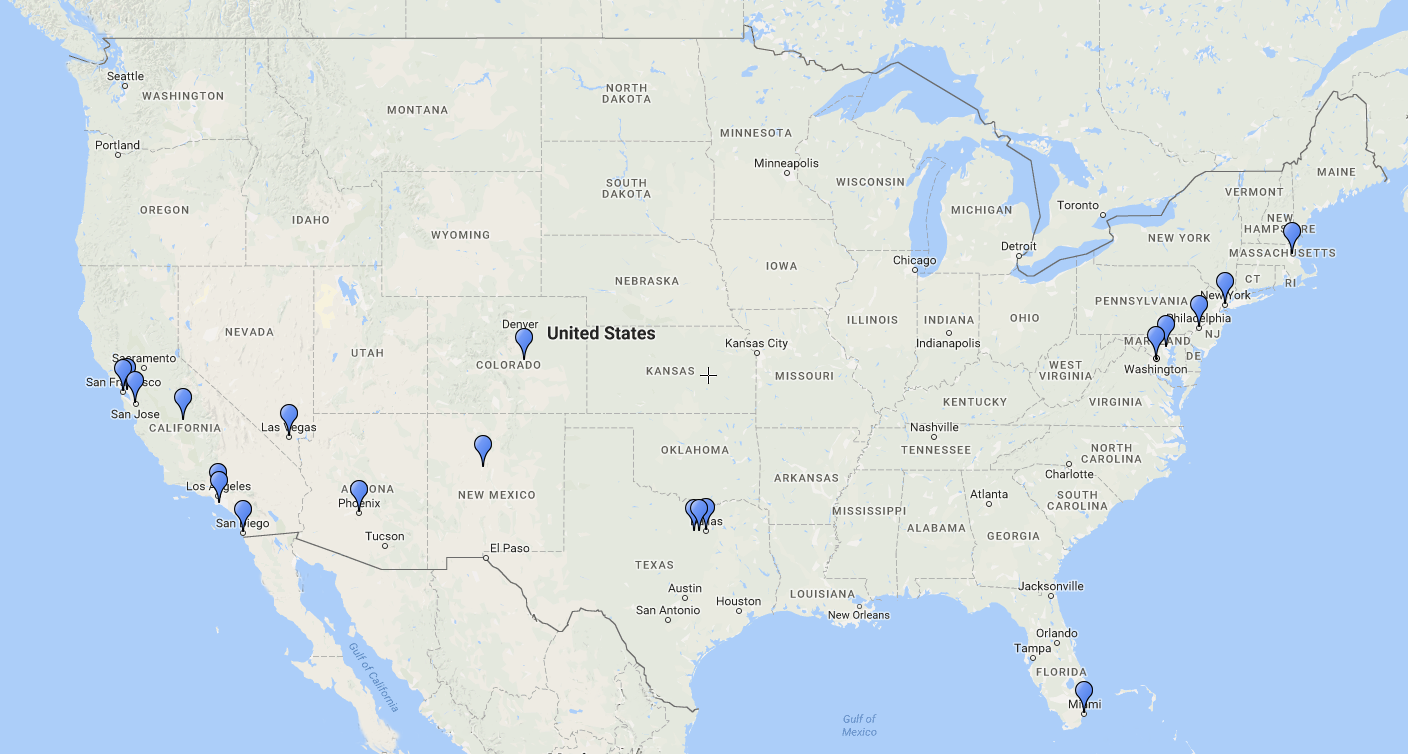 Figure 3: The 20 cities (of the 50 largest cities) in the U.S., where the financial returns from an upfront cash purchase of a 5kW solar system outperform 25-year returns from the stock market.
While the study makes a number of assumptions, including that current favorable policies—like net metering—will continue, it provides a handy illustration of the fact that solar can be a very smart investment in most areas of the country.
And, this value doesn’t even include the potential increase in the value of your home as a result of installing solar, which studies have found can be significant. Another study, by the U.S. Department of Energy’s Lawrence Berkeley Laboratory , found that a typical PV system can add a premium of about $15,000 to a home’s value!
The financial returns of a particular solar installation will vary depending on a number of factors including the cost of the panels, your local utility rate, and the way that you finance it. Your solar installer should be able to give you a clear picture of the value a proposed project will provide. If they use software like Aurora’s, they’ll be able to easily generate projections of the financial returns from a specific solar design under a variety of different financing scenarios.
Key Takeaways:
- While installing solar can be a big expense, in many cases the value it will provide over time exceeds the rate of return from the stock market.
- Net Present Value (NPV) provides a way to quantify the present value of the future savings a solar installation will provide.
- It is important to consider different financing options for your solar installation because the NPV of the purchase will change under different financing scenarios. This is because money today is worth more than money you receive in the future; financing options that reduce your initial cash expense by distributing over time can help improve the value of your investment.
- In 46 out of 50 of the biggest U.S. cities, investment in a solar installation provides a better return than an equivalent stock market investment indexed to the S&P 500 (for a 5 kW installation fully financed by a loan with a 5% interest rate). In 20 of those cities, an upfront, cash purchase of a 5 kW system also provided greater returns than the stock market.