In a young industry like solar, policies can have a critical impact on growth. Those impacts may be positive—for example, net metering has been a key policy for making solar cost-competitive in the U.S. (as have feed-in tariffs in other areas)—but that’s certainly not always the case.
Over the last couple of years, one of the biggest policy shake-ups in the U.S. market has been the imposition of Section 201 solar tariffs on imported solar cells and modules. The solar tariffs made imported modules more expensive, counteracting years of dramatic cost declines.
New research from the Solar Energy Industries Association (SEIA) quantifies the impact of the Section 201 solar tariffs. The report, The Adverse Impacts of Section 201 Tariffs, assesses the market impacts from 2017 (when the solar tariffs came under consideration) through 2021.
SEIA finds that the solar tariffs, which have made U.S. solar module prices among the highest in the world, significantly slowed the pace of solar adoption—costing $19 billion in private sector investment, 10.5 GW of solar capacity, and 62,000 jobs!
While broader market reports are optimistic for the future of our industry—projecting that total installed PV capacity in the U.S. will more than double over the next five years—these striking numbers underscore how much faster solar industry growth could have been. In today’s article, we take a look at the details of SEIA’s analysis.
Section 201 Solar Tariff Background
In January 2018, the U.S. government imposed a 30% tariff on all imported crystalline silicon PV (c-Si PV) modules, under Section 201 of the Trade Act of 1974. This followed significant industry uncertainty starting in early 2017 as a result of the pending trade case brought by two module manufacturers. The tariff which started at 30% in 2018, gradually drops down by 5% per year, dropping to 15% in 2021.
These solar tariffs resulted in prices “43 – 57% higher than the global average, leading to higher prices for customers and reducing overall demand,” reports SEIA.
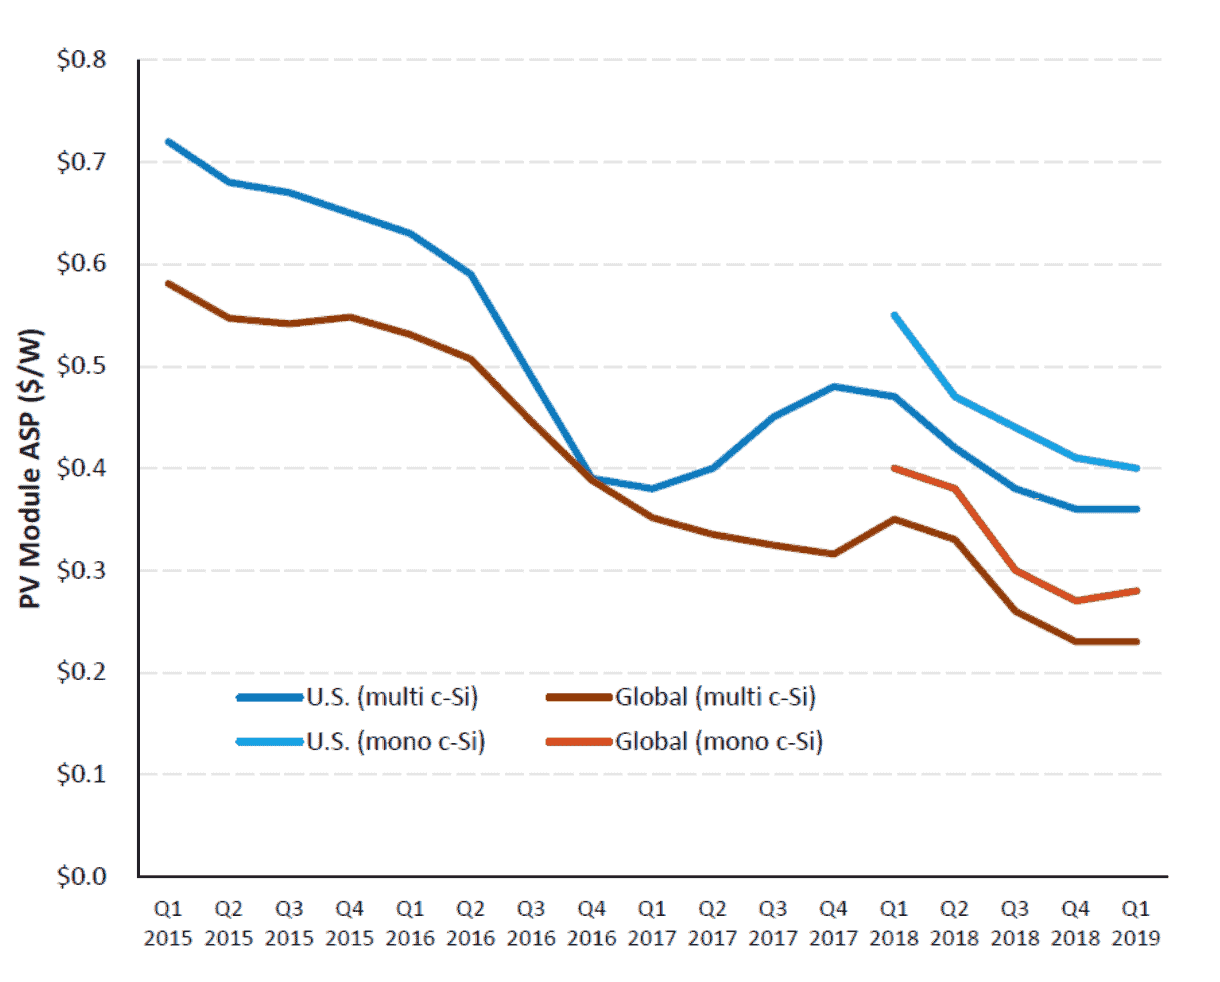 A comparison of U.S. (blue) vs. global prices (red) for monocrystalline and polycrystalline silicon modules. Source: SEIA, The Adverse Impacts of Section 201 Tariffs.
Higher Prices, Slower Market Growth
One of the key findings in the new data from SEIA is how these higher prices have impacted solar adoption. One of the easiest ways of understanding this is to look at how the solar tariffs have changed the Levelized Cost of Energy (LCOE) of solar. If you’re not familiar with LCOE, it is a common metric used to compare the per-unit cost of different types of energy.
Solar competes against other energy types; higher component prices “reduce the size of the addressable market by pushing economics in favor of substitutes (existing generation, gas and wind) in marginal markets.” In areas where there is a thin margin of price difference between solar and other energy types, these price increases can make the difference in whether a solar purchase makes economic sense, as illustrated in the chart below.
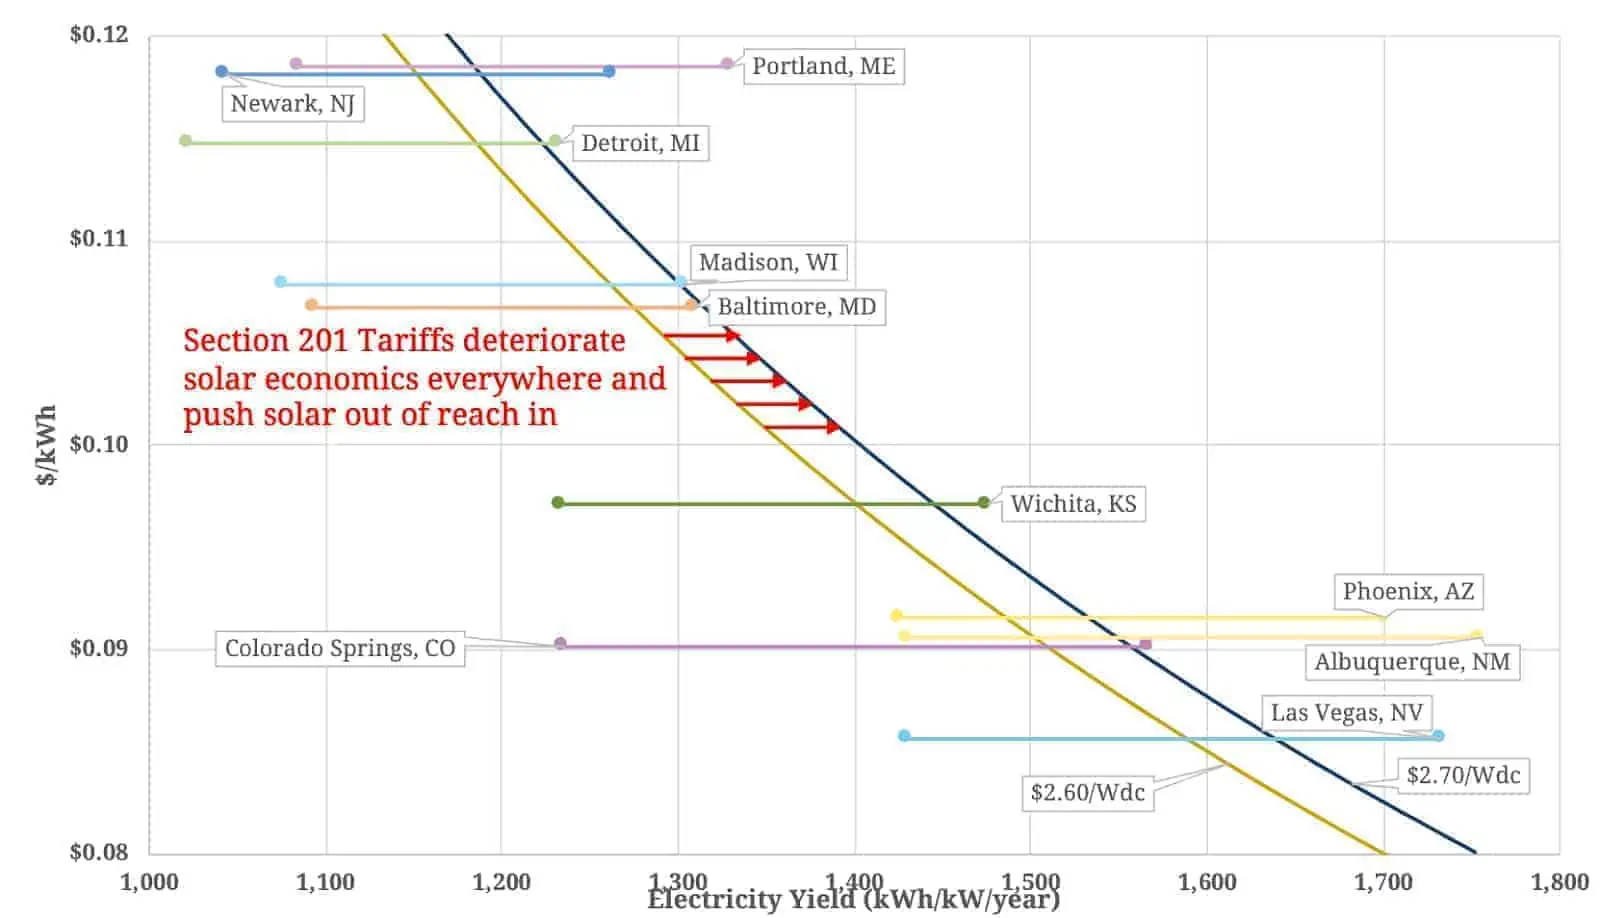 “LCOE by Installed PV Price and Residential Hurdle Rate for Select Cities and Installed Costs.” The two curved lines represent different LCOE values. The vertical position of the horizontal lines indicate the LCOE that a solar installation would need to be below in order to be installed in different cities, and the horizontal distance of these lines represents the range of possible energy yields in that location. Points on horizontal lines that are above the LCOE Curve are financially feasible projects. As you can see, in some areas the price increases from the solar tariffs may push the cost of solar out of reach. Source: SEIA, The Adverse Impacts of Section 201 Tariffs.
Ultimately, as a result of these tariff effects, the market for new projects between 2019 and 2021 has been reduced by 7.5 GW and, in total, more than 10.5 GW of solar installations will not be deployed. SEIA reports that this translates to enough electricity to power 1.8 million homes.
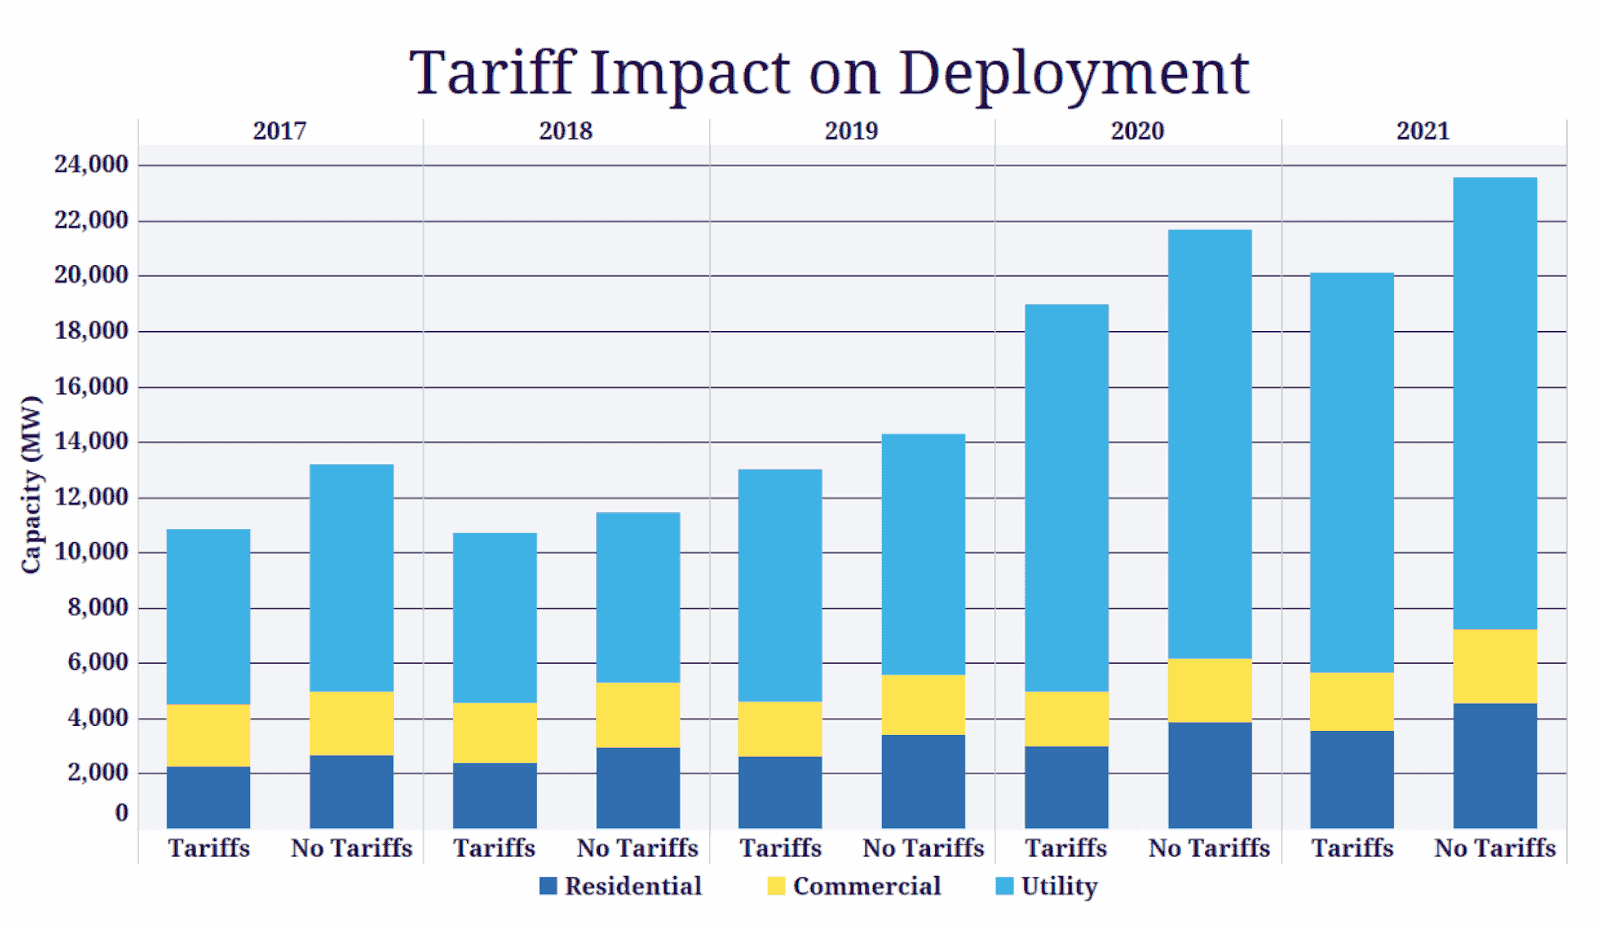 A comparison of estimated solar deployment levels in the U.S. between 2017 and 2021 with and without the impacts of Section 201 solar tariffs. Source: SEIA, The Adverse Impacts of Section 201 Tariffs.
Lost Jobs
As a result of this decreased solar demand, SEIA estimates that between 2017 and 2021 there will be 62,000 fewer solar jobs than under a business-as-usual scenario.
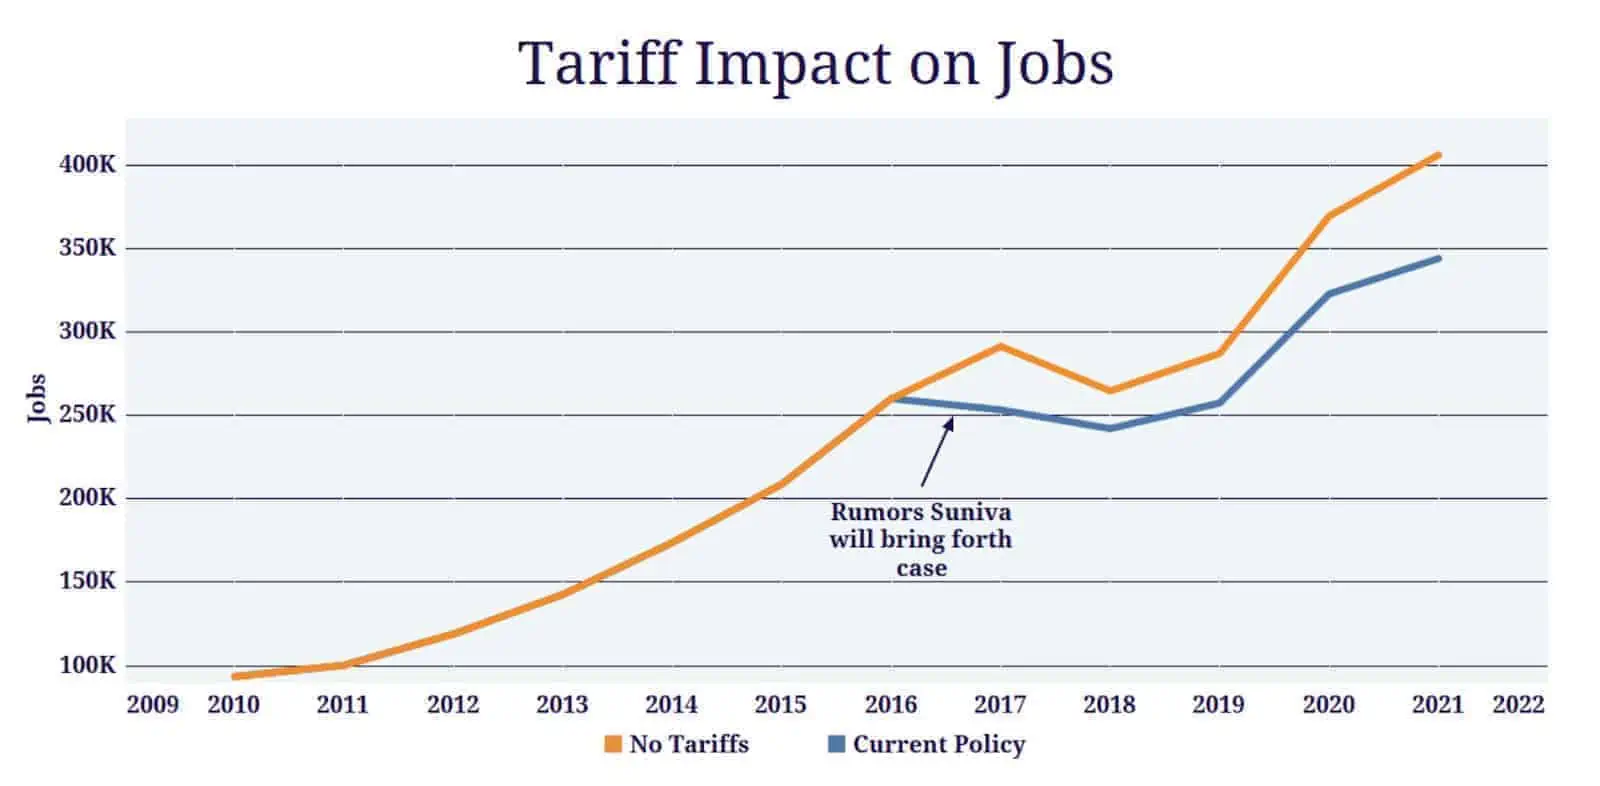 A comparison of estimated solar jobs in the U.S. with and without the impacts of Section 201 solar tariffs. Source: SEIA, The Adverse Impacts of Section 201 Tariffs.
Lost Investments
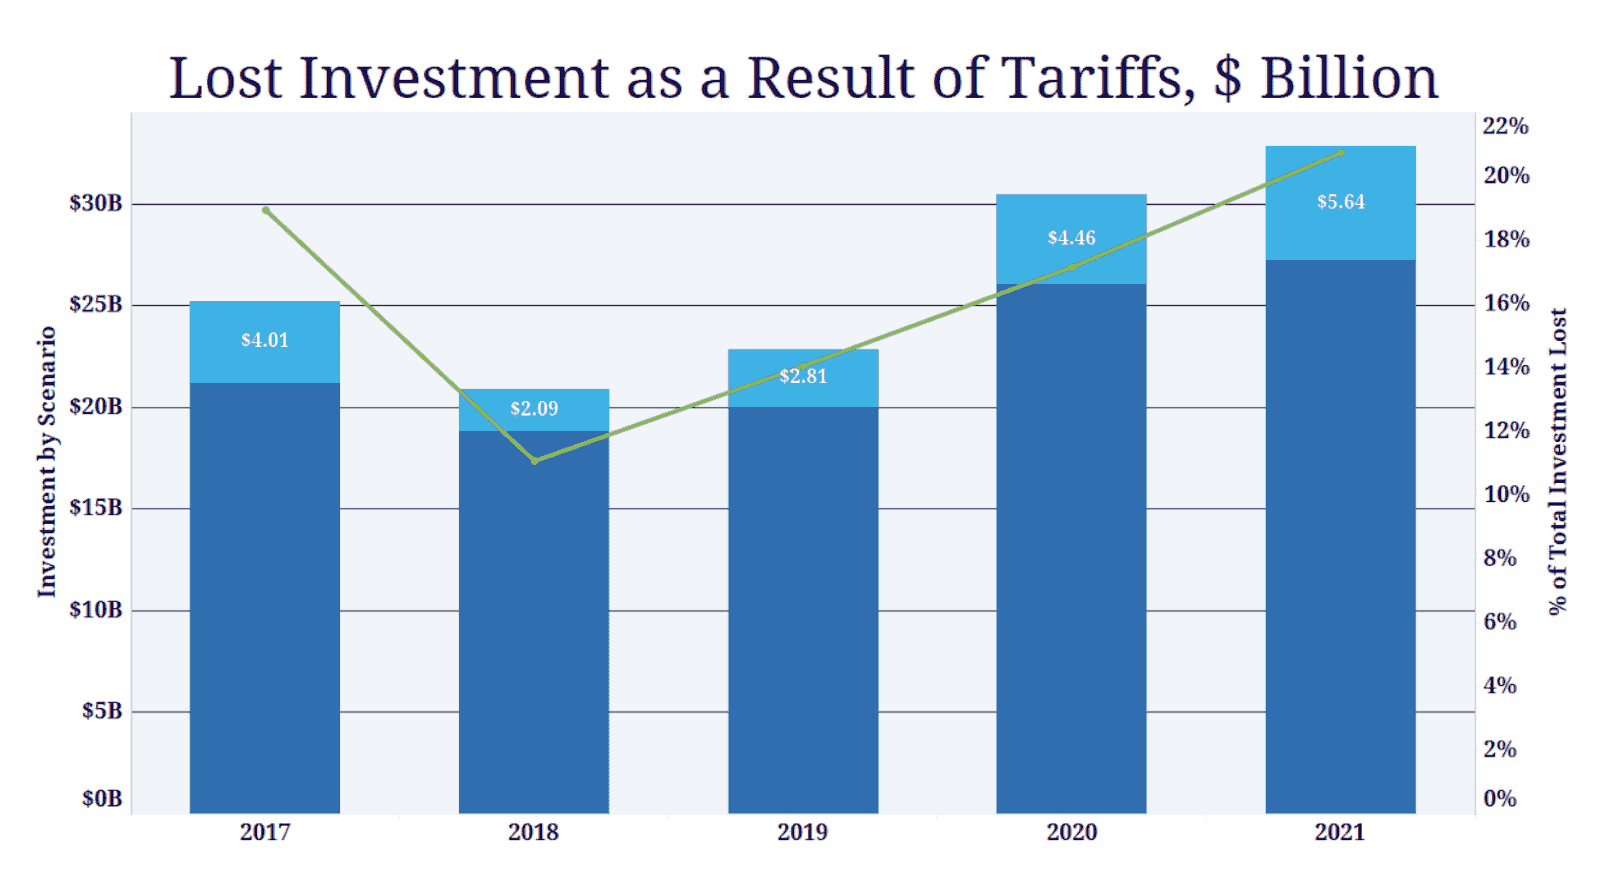
Similarly, cost increases from the Section 201 solar tariffs resulted in reduced investment in the solar industry. In total, SEIA estimates that $19 billion in investment opportunities was lost as a result of the policy changes.
The solar tariffs applied under Section 201 could have been worse; the industry has continued to make progress and forecasts point to a bright future ahead. (Stay tuned next week for a round-up of new state policy developments, many of which are positive for solar.)
However, these figures put into context the impacts of this national policy change on our industry at a macro level. Beyond the economic impacts, the slowed pace of solar growth had other significant effects as well. SEIA reports that CO2 emissions will increase by more than 26 million metric tons, equal to emissions from 5.5 million cars or 7 coal plants.
As a solar contractor, you’re on the front lines of bringing about a new, cleaner energy future. We’re thankful for the work you’re doing and aim to give you the tools to succeed—from lowering soft costs to sharing solar sales tips and interviews with industry leaders.
Let us know in the comments below what new articles would help you, or how your company has coped with the ups and downs of the industry!