Net energy metering (NEM) policies play a crucial role in making residential solar installations a good investment for homeowners in the United States, so it’s important that solar contractors have a clear understanding of them. This is particularly true now, as many electric utilities have begun introducing changes to their NEM programs that reduce the value of distributed solar.
We’ve previously written about changes to net energy metering policies but we’ve been hard at work conducting research to determine exactly how different policy changes affect customers’ utility bills and solar savings. In fact, we’ve recently completed an extensive study with over 30 pages of detailed analysis on the financial and design implications of NEM changes around the country!
In this article, we are excited to explain how some of the common utility revisions to net metering impact solar customers’ savings and bills. In a subsequent article, we delve into how some of these policies result in new solar design best practices in order to maximize your customers’ solar savings.
Standard Net Metering
Standard net metering rules have a straightforward theme – every kilowatt-hour (kWh) of excess solar energy sold to the grid is valued the same as every kWh of energy purchased from the grid to use in the house. Tiered and time-of-use rates complicate the math slightly but, for any given hour, a solar homeowner who exports 10 kWh would receive the same dollar amount of credits as they would have been charged by the utility if they had consumed that amount of energy from the grid.
However, the closure of initial net metering programs, whether due to the utility reaching a specified installation capacity limit or as a result of a legislative change, has brought about a variety of new policies that chip away at some of the traditional net metering rules. These include:
Non-Bypassable Charges
California’s NEM 2.0 program features non-bypassable charges, a portion of the electric rate that customers with solar pay for but cannot offset with solar energy production. These charges both add to the customer’s bill by virtue of being non-bypassable and slightly devalue their exported solar energy.
Percentage Reduction of Exported Value
Some utilities such as NV Energy have instituted a percentage-based reduction in the value of solar energy exported to the grid. Under these policies, customers lose a percentage of their credit for excess energy. For example, under a 10% reduction, if the rate schedule specified $0.20/kWh electricity price, then the customer would receive only $0.18/kWh exported to the grid. The exact percentage reduction depends on the terms in place when they interconnect to the grid.
Flat Export Rates
Rather than tying the value of exported kWh to the retail electric rate, some utilities have implemented a flat export schedule similar to a Feed-In-Tariff (FIT) or Buy-All, Sell-All policy. The difference between FIT compensation schemes and NEM with a flat export rate is that customers on flat export rates net up their energy first (offsetting regular-rate usage from the grid) before exporting their excess energy, rather than selling all energy to the grid at a flat rate.
Not All PV Production Is Reduced in Value
If we look at an overlay graph of household energy consumption and PV production, there are three distinct regions:
Consumption from Grid
Consumption from PV
Excess PV Production
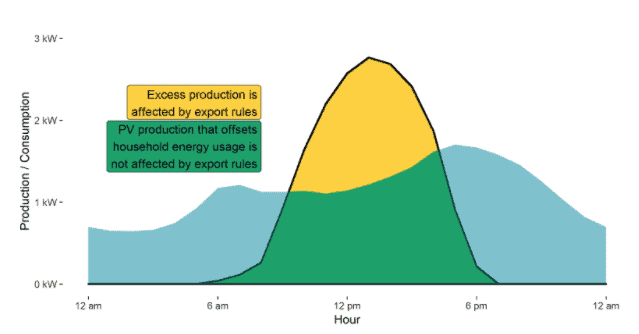
Customers are charged for the kWh area in blue and receive no charge for the kWh area in green. The kWh area in yellow indicates excess PV production that is exported to the grid, and the hourly rules listed above only change the credit rate for the yellow region. Customers who can align their production and consumption levels will be less impacted by the rate changes. We’ve found that anywhere from 20% to 60% of the energy produced by a PV system is in excess of concurrent consumption.
House Size Matters
Households with larger energy consumption and a larger PV array have production and consumption curves with similar characteristics to smaller buildings, simply scaled up. However, this means that the number of kWh exported under reduced credit rate is higher for higher-consuming locations. As a result, if a household consumes 18,000 kWh per year and offsets 90% of their energy from solar, they will lose more credits to these new policies than a household that consumes 9,000 kWh per year with a PV system that offsets 90% of their energy.
Credit Expiration
While NEM customers can typically take excess production credits from summer months and apply them to energy charges in winter months, most NEM programs stipulate that credits earned from excess production can’t be carried over indefinitely. A few examples of these rules are as follows:
PacifiCorp in Utah has the most common setup, where customers pay each month for any net energy consumption and excess NEM credits are expired once a year at the end of a specified month — March in this case. Other utilities stipulate other times of the year which are less advantageous; December expiration means that customers might have to pay a bill in January and February, and an expiration in October would mean that the customer has to pay most of their bills for the entire winter season.
Some Investor-Owned Utilities, such as Pacific Gas & Electric in California, stipulate that excess credits are expired at the anniversary of when their PV system received permission to operate (PTO), or every 12 months. These NEM customers are billed only once per year (paying only for their net consumption after all credits are applied), however, so the end result is similar to customers who have indefinite credit holding.
Other utilities don’t let customers carry credits from one month to the next at all, and instead pay for excess any kWh credits remaining at the end of the month at a much lower, close-to-wholesale rate (this is typically called net surplus compensation). The rate is usually based on the utility’s generation costs and is about a third or less of the overall electric rate.
Here’s a visual example of how the different credit expiration rules play out given the provided charges and credits built up over a year, ignoring fixed and minimum charges. (It should be noted that these examples represent PV systems in the Northern Hemisphere; in the Southern Hemisphere the same principles apply but the months in which systems produce more or less energy will be different due to differences in seasons.)
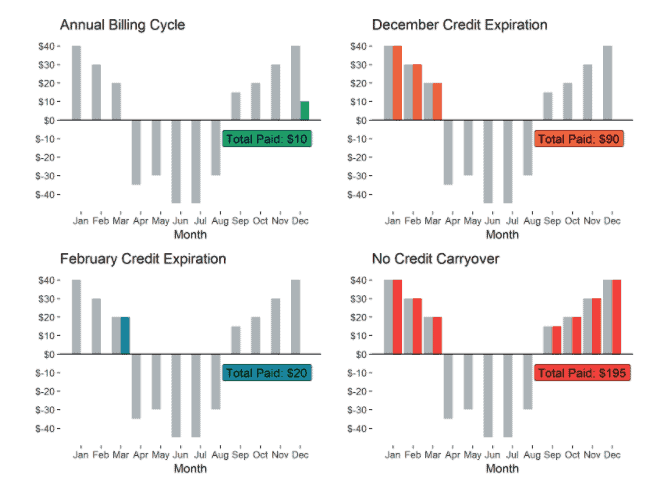
The net value of all the charges and credits amounts to $10 over the whole year, which is the lowest a solar customer could pay. The customer with an annual billing cycle pays only $10, since their excess credits can be applied to all other months.
The customer with credits expiring in December can build up a surplus set of credits from April to August when their PV system is likely to be receiving more sun and producing excess energy, and then use these credits to offset their energy use in September through December when their PV system is likely to be producing less. However, they lose their credits at the end of December, so they still have to pay for electricity charges in January, February, and March, which amount to $90.
The customer with credits expiring in February gets to use their surplus credits in January and February as well, which cuts their bill paid down to $20, almost as good as the customer with the annual billing cycle.
If a customer doesn’t have credit carryover, they end up paying for net usage in any month that they build up charges, amounting to $195 in our example.
As a solar contractor, it is important to be wary of the NEM rules in the customer’s local area to ensure that you accurately portray customers’ solar savings. Software like Aurora, which has tools for modeling utility rates and conducting financial analysis, makes this easy.
Additional Resources for Understanding These Rate Changes
In today’s article, we’ve covered some of the key ways that NEM programs are being revised and what they mean for solar customer’s bills. In a subsequent article, we’ll delve into the new solar design rules-of-thumb that we have identified to maximize customers’ solar savings under different NEM policy types. We’ll also investigate how future updates could impact some of the trends we’ve found.
In the meantime, if you’re looking to deepen your expertise in this area, you can check out the full findings of Aurora’s extensive research on this topic (we analyzed over 45 million scenarios!) in our white paper. We also invite you to tune in to our upcoming webinar on June 27 (link below!) where we will discuss these new policies, who they impact, and new PV design considerations from these policies.