This blog is the second in a series looking at considerations you should take when designing solar PV systems for California’s new Net Billing Tariff (NBT), also commonly referred to as NEM 3.0. In this article, we will take a look at considerations for system orientation and system size to help maximize the benefit of a new PV system. For additional information, we suggest taking a look at the previous NEM 3.0 article describing the billing process and our article that covers tilt and orientation factors.
Getting started — looking at where PV energy goes
In a solar-only system (one without an attached battery), the electricity produced by the PV panels is either used immediately at the property (self consumption), or it can be sent out to the grid (exported). In addition to this distinction, we also need to focus on the time of day when the energy is produced, designating the production as either being “on peak” during the hours of 4 pm – 9 pm when electricity is the most expensive, or “off peak” for all other hours.
The plots below show a familiar shading if you read the previous article, with (a) showing a production and consumption profile for a Los Angeles-area house with a south-facing PV system, (b) showing shading based on whether the production is on-peak or not and whether that energy is self consumed or exported, and (c) showing a breakdown of those energy totals in terms of kWh and bill savings.
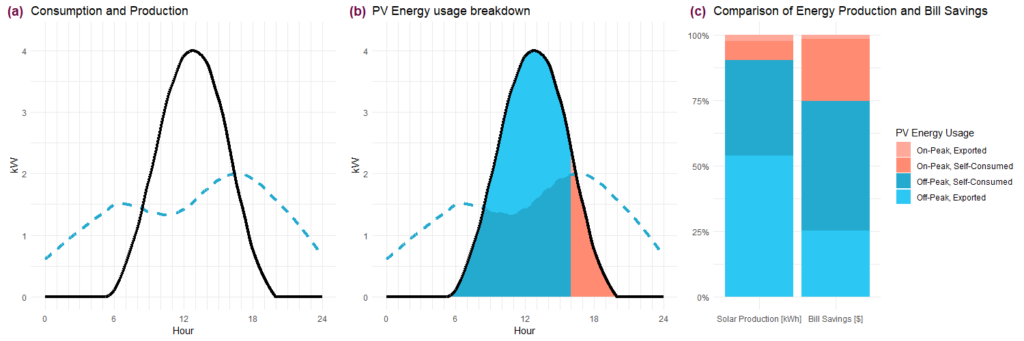
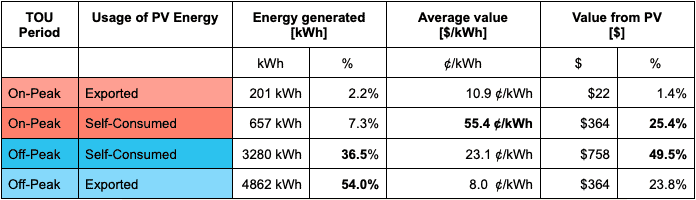
You can see in chart (c) that about 90% of energy is produced during off-peak hours, but the key for residential solar is the monetary value of that energy. Our previous post discussed how self consumed energy was more valuable than exported energy, and you can see that here: Even though on-peak, self-consumed energy makes up only 7.3% of all of the PV production in the above example, it produces 25.4% of the value of the system to the owner because that energy is worth a whopping 55 ¢/kWh. In contrast, exported energy during off-peak hours is only worth 8 ¢/kWh. Off-peak self consumption also pulls its weight, accounting for about 50% of the value from 36% of the production. The table below provides a detailed breakdown of the energy and its value.
Changing the orientation
The example above applies only to a south-facing system, and the common rule-of-thumb in the solar industry is that you can maximize the energy output by orienting your system towards the equator and having a tilt slightly less than latitude (180 degrees azimuth, 20 degrees tilt in the above case). However, as we see in the example above, not much of that energy is produced during the peak energy hours. Let’s take a look at what happens if the system has a non-south orientation.
The animation below shows the same info as chart (b), but over a range of orientations instead of just the south-facing one. You can see that east-facing systems have a relatively low maximum output and very little energy produced during peak hours, that south-facing systems have a higher maximum output, and then shifting west from there provides more energy during on-peak hours but less energy overall.
Converting the areas under the curve into bars representing energy and savings like in chart (c) above, you can see that the maximum production occurs for a system that faces just slightly west of south (morning clouds tend to reduce production when the sun is to the east), but the maximum bill savings is much further west, at about 230 degrees azimuth.
This indicates that a southwest facing system is the best financial option for a Los Angeles area system that offsets 100% of the homeowner’s energy usage.
Gauging designs across the state
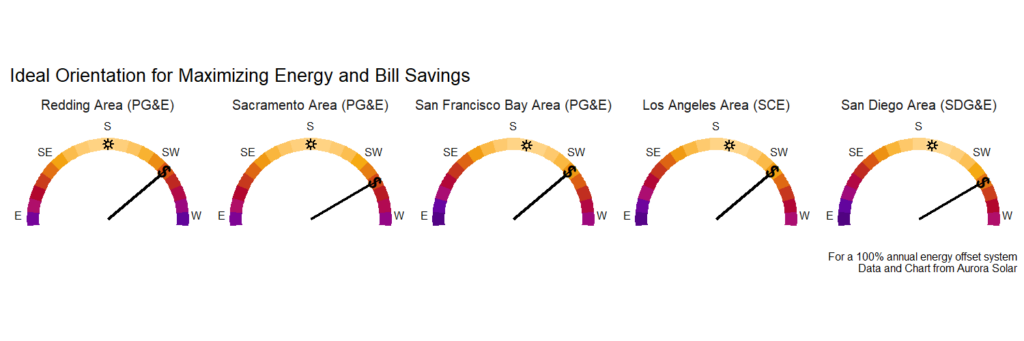
Reviewing orientation for 100% offset systems
We repeated the analysis we did for the Los Angeles area at other locations across California, and found that the same concept holds true across the state — production is greatest for systems facing south, but under NEM 3.0 the ideal orientation is southwest to maximize bill savings.
It’s also important to note that south-facing and west-facing systems are still perfectly fine — southwest only benefits the customer about 5% more compared to due south or due west. However, be careful with east-facing systems, as these yield 20% less bill savings than the southwest option.
What about smaller systems?
Our above analysis is for systems that have 100% energy offset on an annual basis. However, given the low value of exports to the grid, you can design a system with a smaller annual offset, which in turn has a lower proportion of exported energy, resulting in a greater value per kWh and a shorter payback time.
The table below shows the results for the Sacramento area, but all regions have similar trends — the orientation stays close to southwest regardless of system size, and the ideal system size based on payback period is around 60% annual energy offset. In contrast, the sweet spot for a NEM 2.0 system was facing south (190 degrees azimuth) at 100% system offset. Under the NEM 3.0 rules, larger systems still have a reasonable payback period (and may have a greater net present value) but it will take longer.
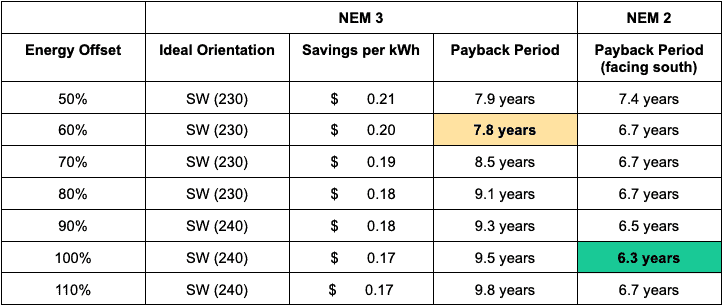
when accounting for rate escalation. We also assume that projects with a smaller system size
have a greater price per watt, since fixed costs don’t scale down for smaller systems.
What about different load profile shapes?
Another important consideration in PV system design for NEM 3.0 is the customer’s load profile. In general, having PV production align with consumption will result in more self consumption of energy, which is more valuable.
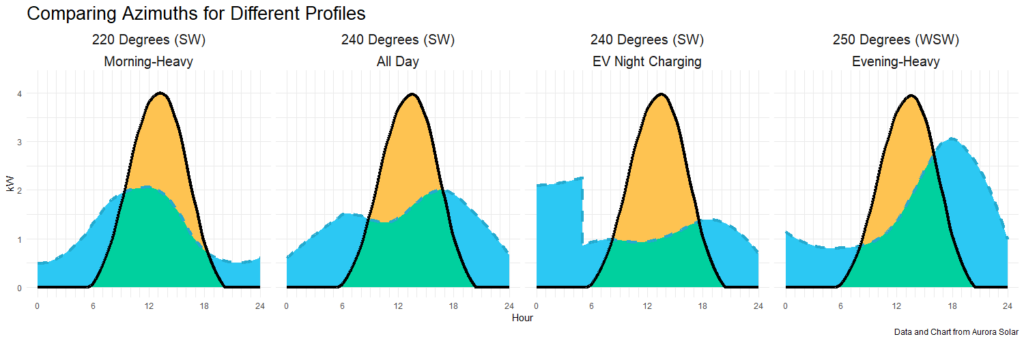
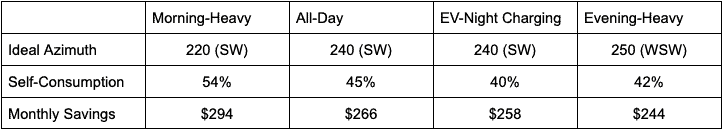
We repeated our analysis using different typical load shapes, representing a morning-heavy, evening-heavy, and an EV-charging case in addition to the “all day” case used above. As shown below, the ideal azimuth is indeed shifted, but only slightly — a morning system is better off with a SW facing system, and evening-heavy is 10 degrees further west. So in terms of design, there’s a small consideration with orientation but it’s not going to drastically change your outcome under typical load profile shapes.
However, it’s important to note that the load profile and PV orientation (and resulting self consumption of PV energy) plays a big role in bill savings. All of these generic profiles have roughly the same pre-solar bill, but the savings differ by up to $50/month.
Conclusions
Wrapping up, we see that a southwest-facing system provides the most value to a customer under the NEM 3.0 rules, although south-facing and west-facing designs still fare well. It’s important to be able to iterate through different designs using tools that can model the load profiles, specific production profiles, and NEM 3.0 rules to deliver an accurate design to your clients.
This post also only touches on solar-only systems. To learn more about selling battery storage under NEM 3, see our post on How to educate homeowners on battery storage under NEM 3.0.