When modeling how much energy a solar design will produce, there are many features of the components that must be taken into account to ensure an accurate estimate. One important factor that modeling software must account for in order to avoid over or under-estimating the system’s energy production is whether or not the inverter(s) used are capable of “global maximum power point tracking.”
In this post, we will examine what global maximum power point tracking means — and why accounting for it is so important.
What is Maximum Power Point Tracking?
Maximum power point tracking refers to the combination of PV solar and wind turbines to create the maximum power generation no matter the weather conditions.
Understanding Current-Voltage and Power-Voltage Curves
The datasheet of a solar panel includes a variety of data that allow one to understand the basic parameters of the device and to mathematically model its behavior within an electrical circuit.
Typically, this will include graphs that illustrate the panel’s “current-voltage curve” — also known as an IV curve, for the standard abbreviations for current (I) and voltage (V) in mathematical equations — and “power-voltage curve.”
Looking at the power-voltage curve allows us to see the point (or points) at which the panel’s power output is maximized.
These graphs illustrate the relationships between three electrical characteristics: current, voltage, and power. Power — which we intuitively understand as the energy produced by the panels — is defined as the rate, per unit time, at which electrical energy is transferred by an electric circuit.
Current (I) is the rate at which charge is flowing through the circuit, while voltage (V) is the difference in electric potential energy between two points (e.g., the output wires of a solar panel) per unit electrical charge.
A common example used to explain these principles is to think of electricity like water in a tank; the pressure in the tank is analogous to the voltage, while current would be the flow of water out of the tank (Figure 1). The IV curve shows how the panel output current varies with the panel output voltage. The power-voltage curve shows how panel output power (the product of the output current and output voltage) varies with panel output voltage.

Looking at the power-voltage curve allows us to determine the point (or points) at which the panel’s power output is maximized.
On the IV curve, two values that are often indicated are “Vmp” and “Imp” — which indicate the levels of voltage and current at which the solar panel’s output power is maximized under standard test conditions (STC). Nothing about the panel itself dictates it must operate at maximum power, however; any point along the IV curve is a valid operating point.
In designs using string inverters, it is the inverters that “choose” the operating point. The ability of the inverters to locate the operating point of a solar array at which output power is maximized is referred to as maximum power point tracking (MPPT).
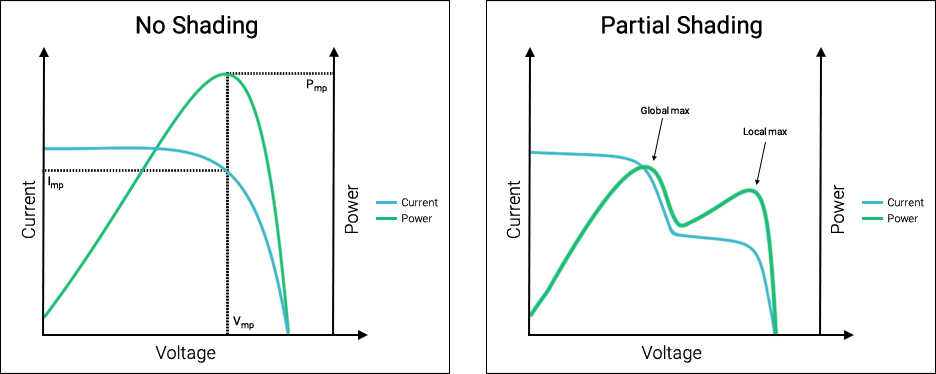
If the solar array comprises identical solar panels operating under the same irradiance and at the same temperature — such that each constituent module has the same IV curve and maximum power point — the net IV curve of the entire array (which takes into account the IV curves of each individual module) will have a shape like the blue curve in the left half of Figure 2 below.
The green curve shows the output power of the array as a function of output voltage; note that there is a single peak in power, occurring at the “knee” of the IV curve. The inverter will seek out this one point at which array power is maximized.

Accounting for Shade: The Role of Bypass Diodes
When parts of the array are shaded, however, the IV curve is much more complicated.
The IV curves of the shaded modules are different than those of the unshaded modules, especially in regard to how much current the shaded modules can output. When the amount of irradiance on a module is low, the power of the entire string connected to the module can drop. This is due to the fact that the current through the string can only be as high as the current through the most shaded module.
Because bypass diodes allow the inverter to “skip over” shaded panels instead of operating at their lower current, the IV curve of an array that is partially shaded will look different than that of an unshaded array.
To help mitigate these effects, manufacturers integrate bypass diodes into their modules. A bypass diode can be thought of as an on/off switch, which conducts any amount of current when it is “on” and, conversely, cannot conduct current when it is “off.” When the diode is turned on, it effectively shorts out the shaded module by routing the string current through the diode (and around the module) rather than through the shaded solar cells.
Because bypass diodes allow the inverter to “skip over” shaded panels instead of operating at their lower current, the IV curve of an array that is partially shaded will look different than that of an unshaded array.
The resulting IV curve may look like the blue curve on the right in Figure 2, with a corresponding power-voltage curve shown in green. As you can see, there are two distinct operating points at which power is “maximized” — a global maximum where the array operates at a higher current and lower voltage, and a local maximum where the array operates at a lower current and higher voltage.
The global maximum occurs when the shaded modules are bypassed, and the local maximum occurs when the shaded modules are not bypassed.
Global MPPT refers to the ability of an inverter to sweep the IV curve of the solar array (within the operating voltage limits of the inverter) and find the array voltage at which the global maximum power point occurs. How often the inverter sweeps the curve, and the resolution at which it does so, is generally manufacturer- and model-specific.
Importantly, not all inverters perform global MPPT. Some inverters are limited to only search for the maximum power point in a local region where it “usually” lies, a high voltage solution where no modules are bypassed. This can be beneficial for sites where there is no shading, because whenever the inverter is sweeping the IV curve searching for the maximum power point it is not actually operating at the maximum power point, and thus not producing as much energy as it could.
If the maximum power point is not going to vary much because there is no shade and no reason to activate bypass diodes, then there is no reason to sweep the entire IV curve.
Most modern residential inverters are capable of global maximum power point tracking because shading due to trees and obstructions is common and expected. Large commercial inverters and central inverters, however, may not have this functionality because it is generally assumed there will not be much shading.
Importantly, not all inverters perform global maximum power point tracking. Some inverters are limited to only search for the maximum power point in a local region where it “usually” lies, a high voltage solution where no modules are bypassed.
Modeling Global Maximum Power Point Tracking
If your design includes a string inverter with global MPPT functionality, it is critical that the simulation tool you use to model the system accurately represents that behavior.
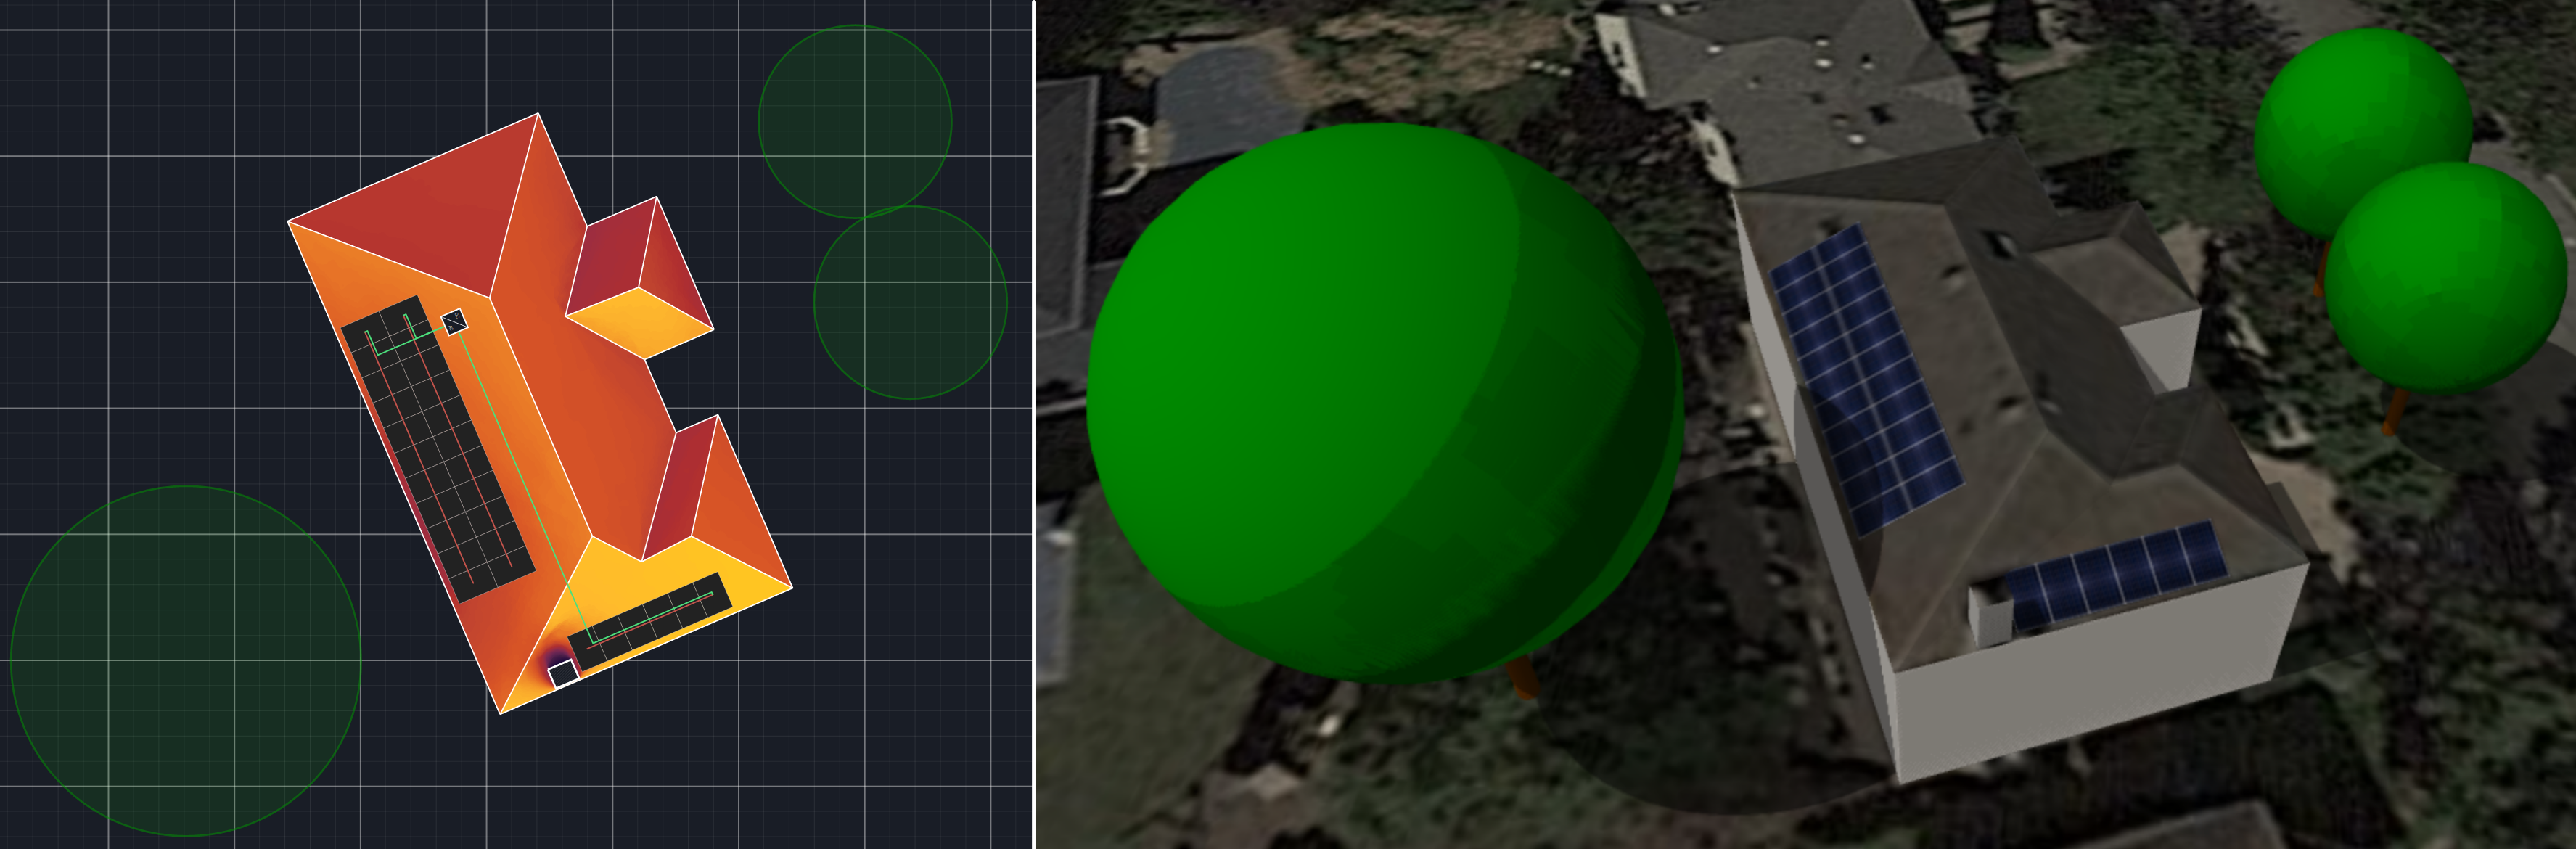
Consider the residential design in Figure 3, which includes two parallel strings connected to an input of an inverter and a third string connected to another input.
The irradiance map (left) and 3D model (right) clearly show the effects of shade on this site. Of particular concern is the chimney on the southeast-facing roof plane and the large tree to the west of the house, both of which cast shade on several panels in the design at various times throughout the year.
If we simulate this design without global MPPT, the annual production is 5.94 MWh. However, if the inverter actually does perform global MPPT, and we simulate it accordingly, the production estimate increases to 6.25 MWh (Table 1).
| Annual Production Without Global MPPT | Annual Production With Global MPPT | Percent Difference |
|---|---|---|
| 5.94 MWh | 6.25 MWh | 5.09% |
Table 1: Annual energy production for a residential design with and without global maximum power point tracking.
Given the results shown in Table 1, it is clear that knowing when to model global MPPT is just as important as being able to model it at all.
Assuming every inverter has this functionality is dangerous because it could lead to severely underperforming systems post-install. Assuming no inverter has this functionality can be a costly mistake as well, because it may lead the designer to install a larger system size than necessary.
This is why Aurora has contacted leading inverter manufacturers to confirm exactly which inverter models perform global MPPT. If a design includes an inverter with this functionality, Aurora will automatically model it. Aurora will even model global MPPT and bypass diodes down to the cell string-level, including the power losses in the diodes themselves.
If Aurora has not confirmed the inverter has global MPPT, or that the inverter only performs local tracking, this behavior will not be modeled. The performance simulation logs will indicate whether or not the simulation applied global MPPT.
In this way, designers can be sure they are getting simulation results that are as accurate as possible given what is known about the equipment in their designs.
Key Takeaways
- Global MPPT allows an inverter to sweep the IV curve of a solar array to find the point at which output power is maximized, even under partial shading.
- We found a difference of over 5% in annual production when simulating a design with an inverter that has global MPPT versus one without it.
Aurora has worked with leading inverter manufacturers to confirm which models apply global MPPT and automatically simulates this behavior for those inverters.
Learn more about the fundamentals of solar by subscribing to our blog.
-
Cover photo credit: NREL/DOE