Commercial customers’ electricity bills are typically comprised of two parts: charges for energy consumption and energy demand. Demand charges are based on a customer’s highest rate of energy usage during any (typically 15-minute) interval in the billing period and often comprise over 50% of commercial and industrial customers’ bills.
And, while installing solar is very effective at reducing the consumption component of customers’ bills, unfortunately, in most cases it does not consistently reduce demand charges.
But what if commercial customers had the ability to switch to a rate without demand charges?
Prior to changes that went into effect in April, commercial customers of California utility Pacific Gas and Electric (PG&E) had an option to do just this.
Using Aurora’s solar design and sales software, we conducted a case study to explore what changes to PG&E’s, previously “solar-friendly,” A-6 rate mean for commercial customers’ savings from solar.
What 2017 Changes to PG&E’s A-6 Rate Mean for Commercial Solar Savings
Until early 2017, when new rate changes went into effect , there were multiple rate plans open to commercial customers with a maximum monthly electricity demand less than 500 kW: A-6 and A-10. While the A-6 rate has a higher price for each kilowatt hour (kWh) of electricity used, unlike A-10 it does not include demand charges.
Before April, commercial solar customers could see substantial savings by switching to the A-6 rate to avoid demand charges.
This meant that commercial customers who reduced their electricity consumption by installing solar could see substantial savings by switching to the A-6 rate because they would no longer need to pay demand charges.
The rate changes, effective April 1, 2017, lowered the maximum level of demand for eligible A-6 customers from 500 kW to 75 kW. This closed off the A-6 rate for a large proportion of commercial customers—and dealt a huge blow to savings from commercial solar projects.
To get a clearer sense of the financial impact of this rate change, we conducted a case study1 of a commercial office building in Sunnyvale, California and compared the customer’s savings from solar under each of these two rates.
 Figure 1: Aerial view of a commercial building in Sunnyvale, California with a proposed 115.50 kW solar installation, designed in Aurora.
Scenario 1: The Financial Returns of Solar under PG&E’s A-10 Rate with Demand Charges
First, we explored how much solar saves the customer when they remain on their original A-10 rate with demand charges. Figure 2 shows the customer’s monthly utility bills prior to installing solar (red) and after installing solar (green). Table 1 shows monthly energy consumption, production, and utility bills.
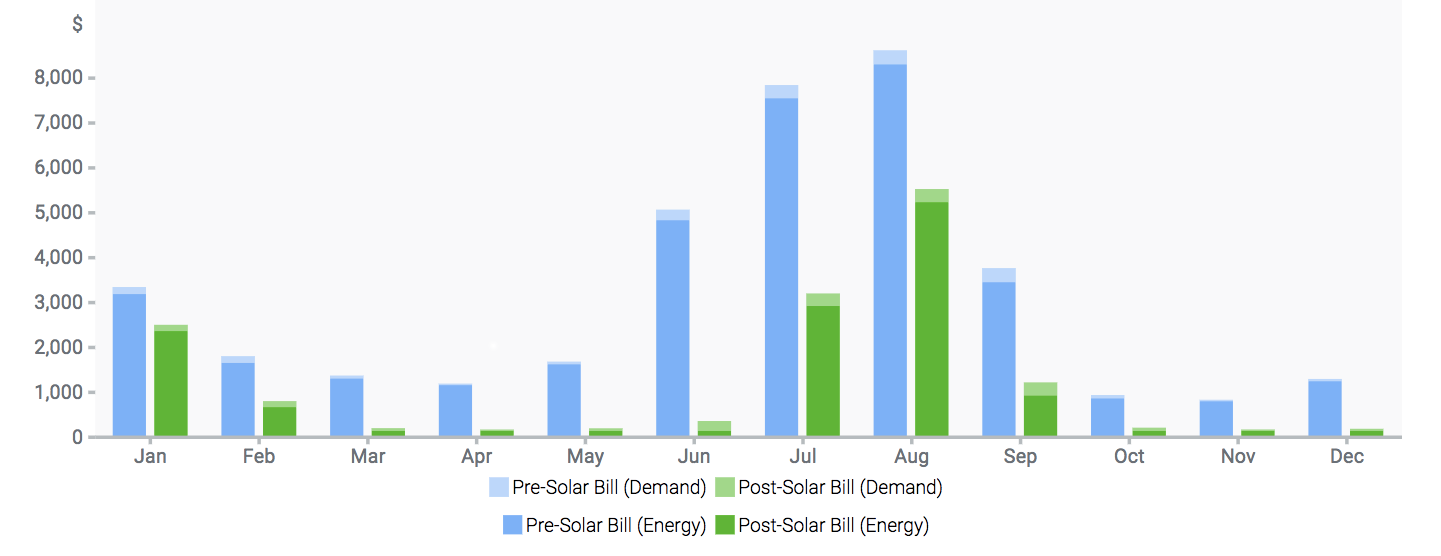 Figure 2: Monthly utility bills for the customer pre- and post-solar, broken into consumption charges and demand charges, under PG&E’s A-10 rate.
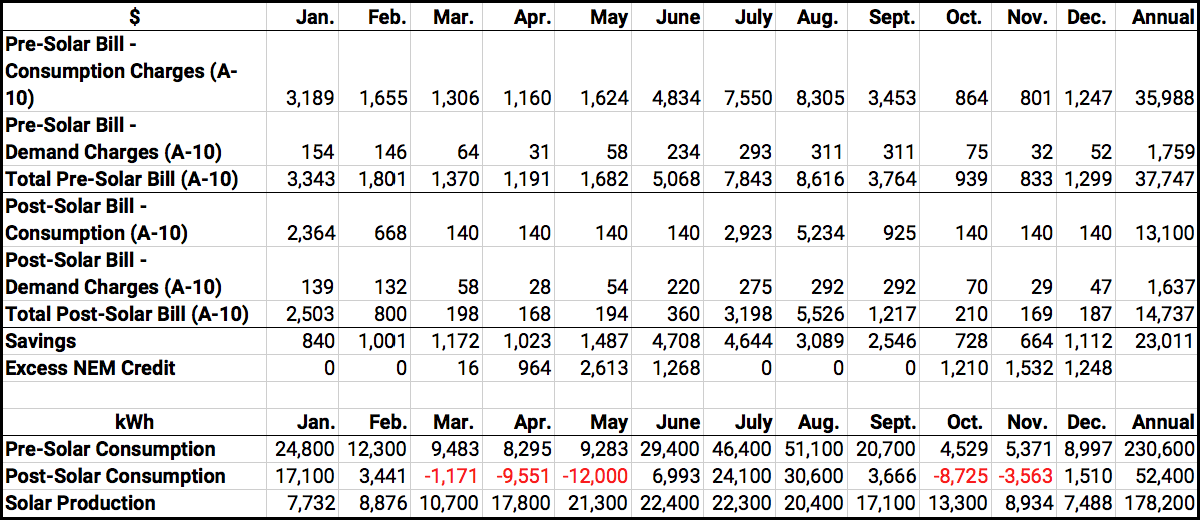 Table 1: Energy consumption and production (kWh) and utility bills and savings for the building pre- and post-solar under PG&E’s A-10 rate.
Even without eliminating demand charges by switching to the A-6 rate, the customer will still achieve sizeable savings from solar by reducing the amount of energy they must purchase from the utility. In this case, installing solar allows the customer to substantially reduce their energy consumption—from 230,600 kWh per year to 52,400kWh per year, a 77% reduction.
However, as a result of demand charges, even for months in which the customer produced more energy than they consumed (March-May, and October-November) and months in which they purchased little or no energy from the utility because of bill credits generated in earlier months from net metering (as was the case in June and December), they still paid the utility between $168 and $210 (comprised of demand charges, as well as some fixed fees).
As a result of demand charges, even in months when the customer purchased little or no electricity, they still paid between $168 and $210.
Scenario 2: The Financial Returns of Solar under the A-6 Rate
Next, we examined what the customer’s savings would be if they were still able switch to the A-6 rate. As you might expect, the savings are significantly higher.
Figure 3 shows the customer’s pre-solar utility bills under the original A-10 rate, compared to post-solar monthly utility bills under the A-6 rate, which has no demand charges. Table 2 offers greater detail on the customer’s estimated energy consumption and production and utility bills and bill savings.
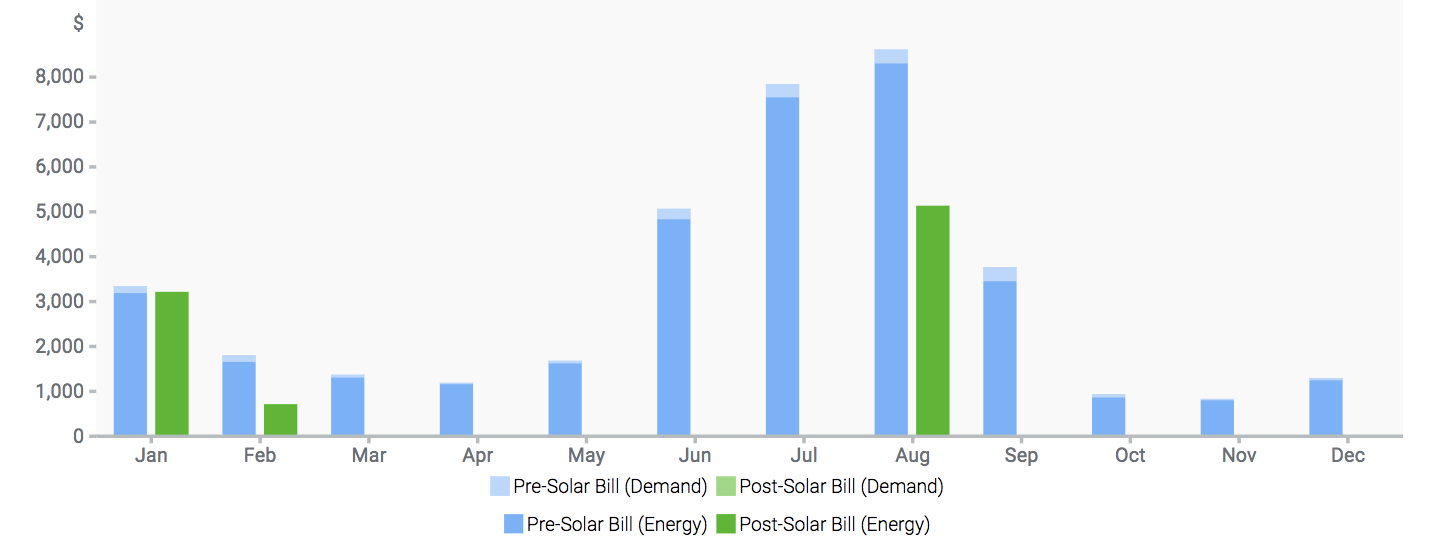 Figure 3: Pre-solar monthly utility bills for the customer under the original A-10 rate, and post-solar bills under the A-6 rate.
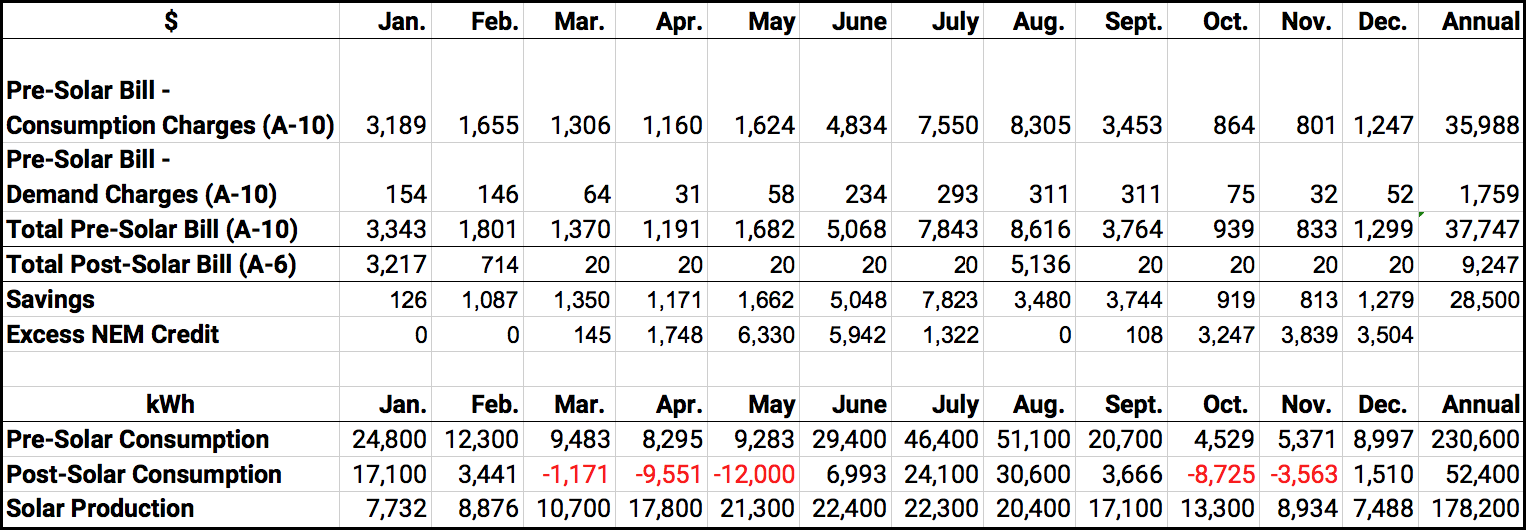 Table 2: Energy consumption, production, and utility bills before solar under the original A-10 rate, and post-solar under PG&E’s A-6 rate.
On the A-6 rate, this commercial customer would pay only $20 in fixed charges for most months of the year, except January, February, and August. This is because the value of the energy they sent back to the grid in the months when their solar installation produces excess electricity (March-May and October-November) was enough to offset their bill in most months.
Quantifying the Financial Impact of PG&E A-6 Rate Changes
To put this in perspective, let’s compare the customer’s bills under A-10 and A-6 rates. As you can see in Table 3, installing solar initially saves the customer 61% of their original bill, even on a rate with demand charges. However, the customer would save an additional 15% if they were still eligible to switch to PG&E’s A-6 rate without demand charges, saving a total of 76% compared to their pre-solar bills under their original rate.
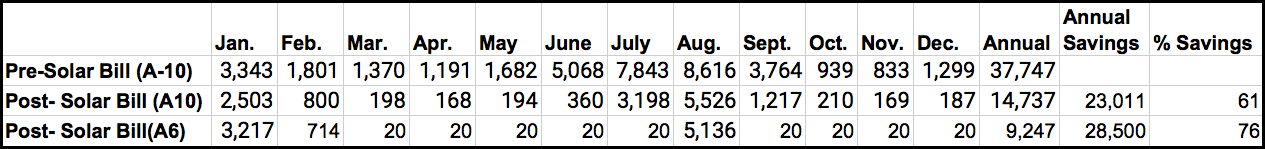 Table 3: Utility bills under rate A-10 before and after installing solar, and under the A-6 rate after installing solar.
Clearly, demand charges have a significant impact on the financial returns from installing solar. And, as you can see, PG&E’s decision to limit eligibility for the A-6 rate , had substantial negative impacts on project returns for commercial solar customers.
As the proportion of renewable energy on the grid increases, we can likely expect more utility rate changes like this around the country. This is because demand charges are one of a variety of billing approaches intended to provide price signals to encourage customers to reduce peak demand. Already, a number of utilities are experimenting with changes that apply demand charges to residential customers . While it is hard to predict exactly what changes your local utility will make, if you’re thinking of installing solar, it may make sense to do it as soon as possible so you can take advantage of current rates.
Key Takeaways
- Demand charges can comprise a significant proportion of electricity bills for commercial customers.
- Solar installations do not consistently reduce demand charges, because the timing of high demand periods may not coincide with when solar panels are producing energy.
- PG&E’s A-6 rate for commercial customers does not include demand charges. Prior to changes that went into effect in April 2017, which lowered the maximum level of demand for eligible A-6 customers from 500 kW to 75 kW, this rate was an appealing option for commercial customers who installed solar.
- In our case study, we find that switching from the A-10 rate to the A-6 rate, as customers could do prior to April 2017, results in an additional 15% savings from solar.
1Notes on methodology:
We designed a hypothetical solar installation for the building (shown in Figure 1) using Aurora’s software. We used sample Green Button Data for this type of commercial customer provided by PG&E to develop a load profile, and then used Aurora’s energy performance simulation and financial analysis features to assess the impact of solar on the customer’s bills under each scenario.